SkillMill Dashboard Features

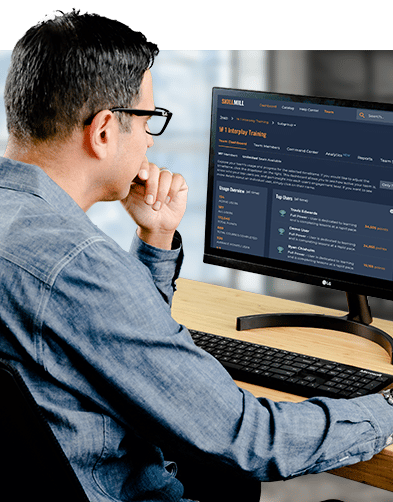
Insights and Monitoring Team Progress
Under the “My Organization” section there are a number of insights you gain:
- Are members of your team actively using the training?
- What are the strengths and weaknesses of your workers?
- Where are the gaps in knowledge that need to be addressed?

With the SkillMill Dashboard, You Can:
- Explore your team’s usage and progress for a selected time period (Information can be filtered by the current week, past four weeks and all time)
- See how actively your team is engaging with the training
- See top users
- Monitor each user’s engagement level (If you want to see more details about an individual user, click on their name)
- Export user progress data into CSV file
WHAT CAN I SEE ON THE SKILLMILL DASHBOARD?
There are many insights you gain from the results of sim training. When your team members attempt troubleshooting procedures in Challenge and Assessment modes, you can see who is “getting it.” Instead of spending your valuable time on lengthy ride-alongs, you can easily log in to your dashboard and see a detailed snapshot of progress and the abilities of your team members.
Seats
Managers can view the number of seats (aka licenses) currently being used, as well as the number of seats still available.
Team Usage Overview
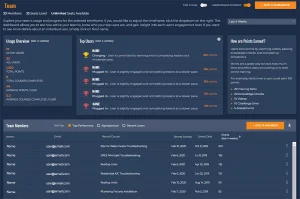
The team dashboard overview lists:
- All Users
- Active Users
- Points Earned
- Average Points
- Courses Completed
- Average Number of Courses Completed by Users
- Member List
Team members can be sorted by top performers, alphabetically or based on recent activity. User information includes email address, most recent course, recent activity date, join date and points earned. The list can be downloaded as a CSV file.
User Rankings
Managers can view the top five users based on points earned in the selected timeframe. Each user will be rated based on individual effort within the training platform. Ratings are based on the level of dedication to improving skills, not necessarily the level of knowledge on given subjects.
Team Leaderboard
You can enable or disable the weekly leaderboard function by toggling it. The leaderboard shows how team members rank compared to their coworkers.

WHAT’S INCLUDED IN THE INDIVIDUAL USER SECTION?
User Detailed View
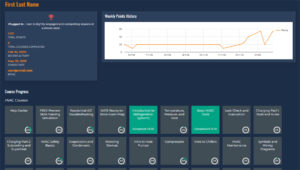
Along with team information, you can also find information on each individual user. You can view the following information:
- Total Points Earned: member’s point history can be viewed via a chart that shows the points earned each week
- User Rating
- Join Date and Recent Activity Date
Course Progress
Managers can view the number of courses completed and the completion rate. Each individual course can be viewed to see the last activity date, as well as the number of attempts for each learning activity.


